Elasticsearch
The Xshield Security Platform can generate events, audits and network flow data that can be used by Elasticsearch to correlate and detect anamolies. Elasticsearch allows operator to define rules that can be executed on detecting the anamolies. These rules provide a mechanism to configure a webhook to make API calls to the Xshield Security Platform that performs operations to prevent any lateral movement between the affected hosts.
Elasticsearch Cloud Setup for SIEM/SOAR-Driven Breach Response
This document provides step-by-step instructions to configure Elasticsearch Cloud as part of a SIEM/SOAR integration with the Xshield Security Platform for a specific playbook; Elasticsearch will invoke (Action) the Breach Response (Quarantine) API on Xshield Security Platform on the detection of events related to communications by malicious IPs (Trigger)
By completing this setup, organizations can establish an automated detection and response workflow—ensuring that critical security events identified in their environment directly initiate breach response actions in Xshield in real time.
Pre-requisites:
- Azure/AWS/GCP Cloud storage. Customer must provision storage in their public cloud instance and provide its credentials to the Xshield Platform. It will be used by Xshield to write all events/audits/network flow data into the provisioned storage.
- Elastic Cloud Instance (hosted deployment). Customer must have a tenant (instance) on Elastic Cloud where the above operation can occur.
- Hosted Elastic Connector. The Xshield Security Platform writes data to the cloud storage in Common Event Format (CEF). This data can be either read directly by Elastic into its cloud instance. Another option is to deploy an elastic connector (for Xshield) that will read the CEF data from the cloud storage and then use APIs to write to Elasticsearch. The latter requires a VM to be provisioned in customer's data center and be configured with Elastic API and the Cloud storage access credentials. The VM requirement are as follows:
- Compute: 2 vCPU, 8 GB RAM, 5 GB HDD
- Operating Systems: Minimum Ubuntu 20.4 LTS
- Configure Breach Response Templates. The relevant breach response templates for the target assets must be configured in Xshield. Please refer to Breach Response
1. Provision Cloud Storage
The first step is to provision cloud storage in customer's public cloud instance and generate credentials (write access) to be shared with Xshield.
2. Configure Elastic Cloud Deployment API Key
The next step is to generate the API credentials that can be used in the elastic connector. This will allow the connector to make API calls to Elastic to forward the data generated by Xshield Security Platform.
- Log in to Elastic Cloud.
- Click on the Hosted Deployment and copy the Elasticsearch endpoint
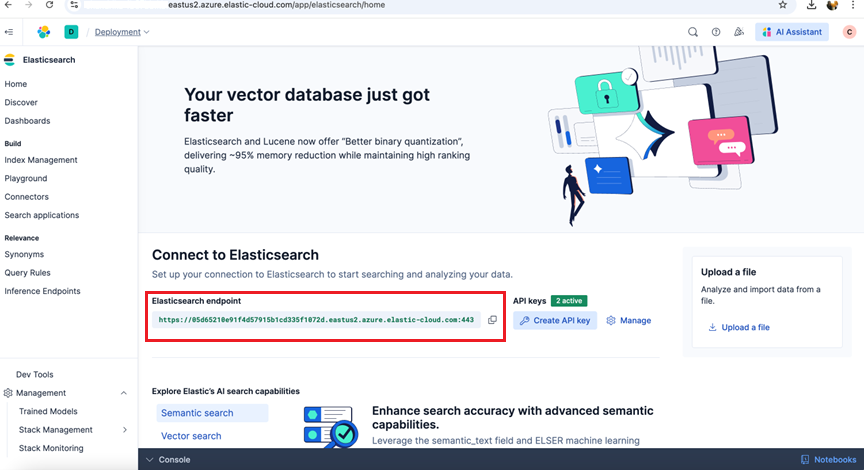
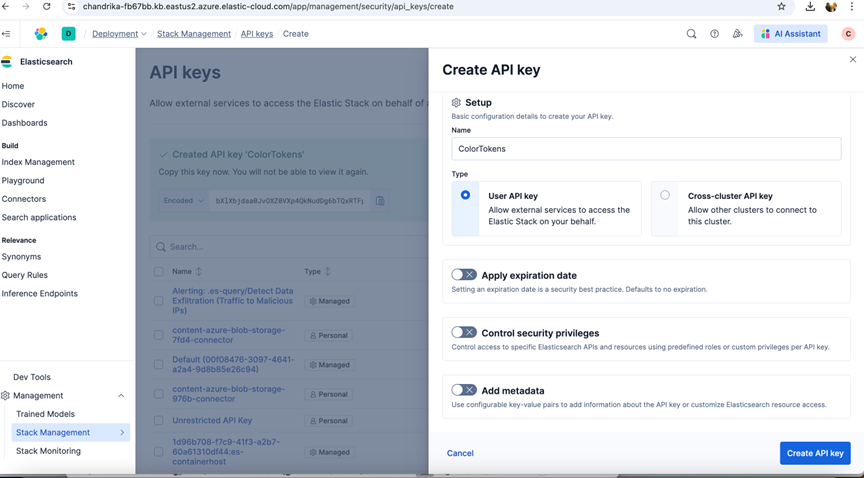
- Create a new API Key and copy the APIKey.
3. Enable Elasticsearch Integration in Xshield
The Elastic Integration on Xshield Security Platform can be done as follows:
- Log into Xshield Tenant
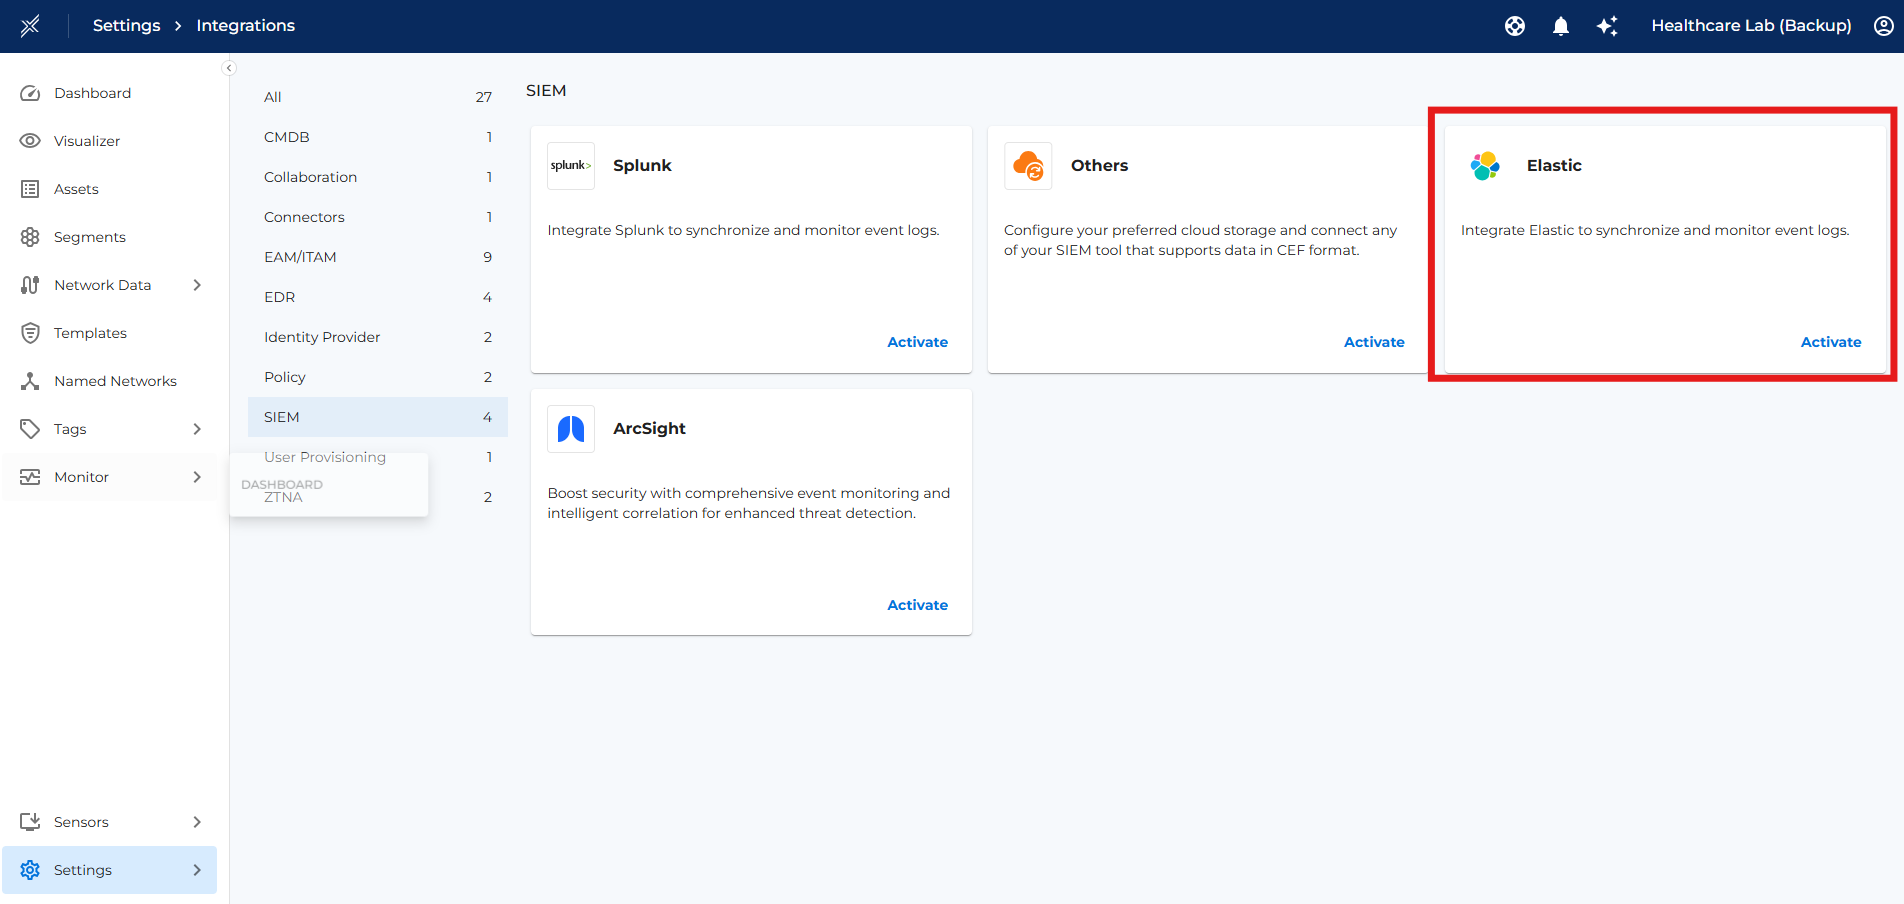
- Navigate to Settings -> Integrations -> SIEM
- Activate Elasticsearch Integration
- Select the cloud type (Azure/AWS/GCP)
- Update the relevant cloud storage access credentials & container
- Select the Data types tobe uploaded (Events, Audits, Alerts, Flows)
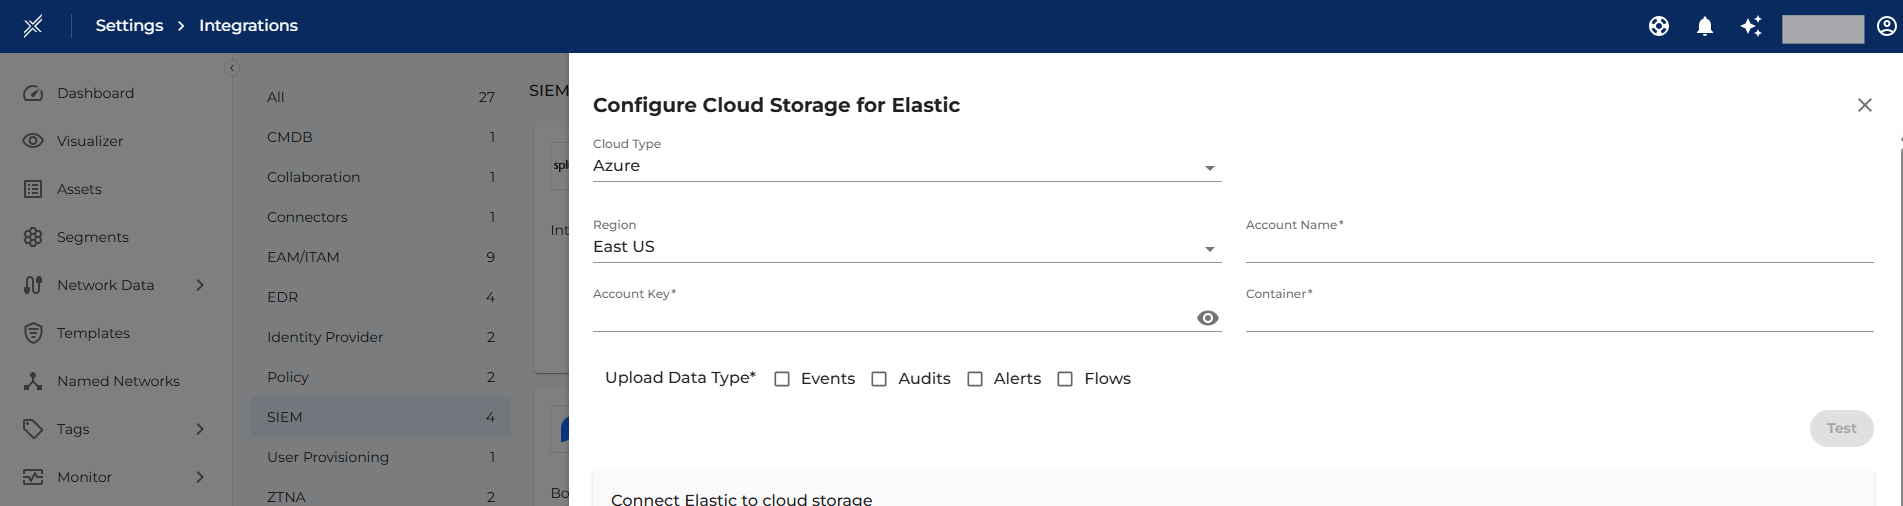
- Confirm the integration by clicking on test and then Save the integration.
4. Data Ingestion to Elastic
Option 1: Sample Ingestion Connector
Firstly, provision the Virtual Machine in your data center as described in the Pre-requisite section.
The Xshield Security Platform offers a sample Elastic Connector that can be downloaded and installed on that VM with the following configuration:
- Credentials to the Cloud storage to read the Xshield generated events (CEF)
- API credentials to Elastic Cloud Instance to write the data natively to Elasticsearch.
- Download the Sample Ingestion Connector from the below URL:
https://artifacts-<domain url>/sample-ingestion-connector/sample-ingestion-connector.zip
Replace <domain url> with your specific domain name to form the correct URL for downloading the CEF Connector.
Example, for demo.colortokens.com use:
wget https://artifacts-demo.colortokens.com/sample-ingestion-connector/sample-ingestion-connector.zip
-
Copy the downloaded the Sample-ingestion-Connector.zip file to the Ubuntu VM.
-
Unzip the sample-ingestion-connector.zip file.
-
Update the env file in the sample-ingestion-connector directory with azure object store details and elasticsearch endpoint and APIKey
-
Detailed setup instructions for the sample-ingestion-connector, are provided in the README.md file and should be followed to setup the connector correctly
Option 2: Elastic Logstash Connector
Elastic provides an option to create a logstash pipeline to process data by using several plugins together, like inputs, outputs, filters, and codecs. To build a Logstash pipeline, create a configuration file to specify which plugins you want to use and the settings for each plugin.
Please follow the detailed steps in the Elastic Logstash Connector site.
5. Verify Data Ingestion
The Sample Ingestion Connector automatically creates an index with the name colortokensdemo.
- Click on the Deployment -> Index Management -> colortokensdemo
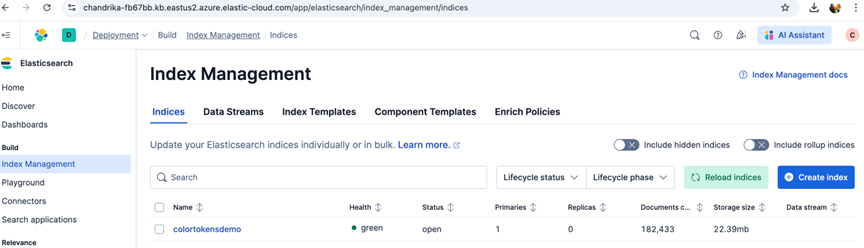
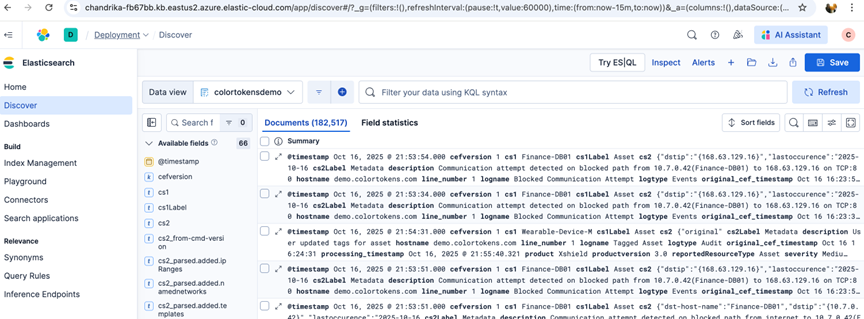
- Click on View in Discover on the index
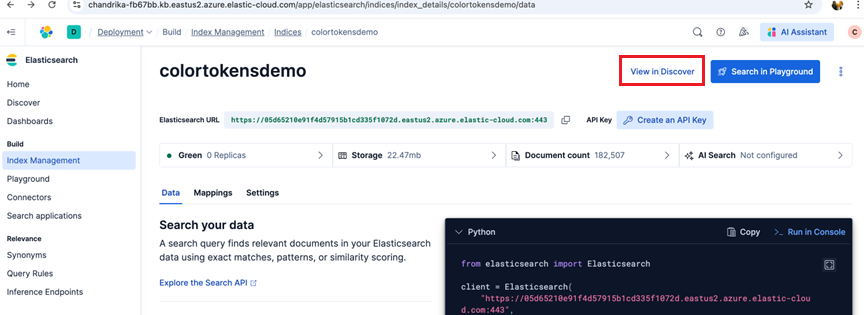
- Verify the ingested data
6. Create a Webhook Connector
Now with the Xshield events available on Elasticsearch, the next step in the integration is to implement a webhook and attach a rule to it. The rule defines the trigger and the action to be performed.
For this playbook, the trigger is 'event reported by a host making a network communication to a known malicious IP' and the action is to make the Breach Response (Quarantine) API call to quarantine the host (as defined in the rule).
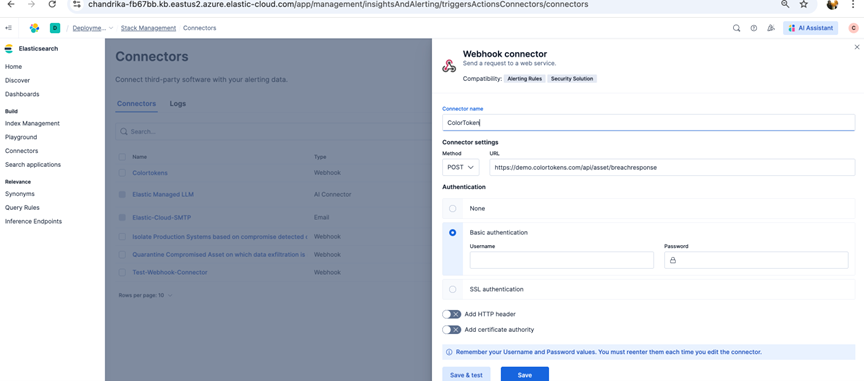
The first step in this process is to create a webhook connector on Elastic Cloud Instance as follows:
-
In Kibana, navigate to Stack Management → Connectors → Create connector → Webhook.
-
Configure it as follows:
- Name: Log Snapshot API Trigger
- URL:
https://demo.colortokens.com/api/assets/breachresponse - Method: PUT
- Authentication: For quick trial and test purposes, a timed bearer token can be used which can be received from Colortokens. This should be set in the HTTP headers. For alternate long lived authentication mechanisms, please contact Colortokens for a detailed document
-
Save the connector.
6. Create Rule to Trigger the Webhook
- In the deployment, click on Stack Management → Rules → Create rule.
- Select rule type as Elasticsearch Query and update the name of the rule.
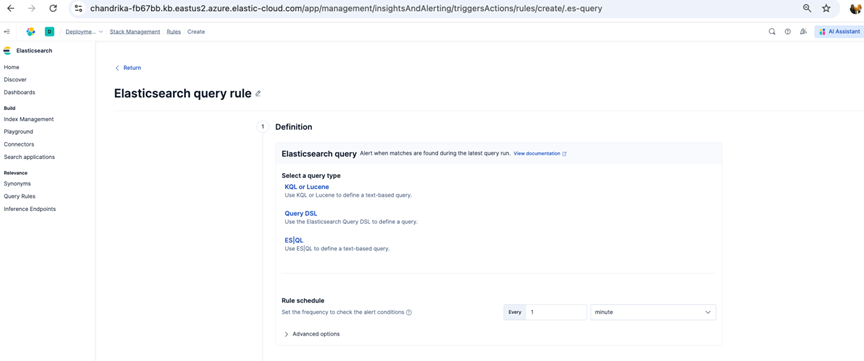
- Configure Rule Definition as below:
The query will look for the below information in the events generated by Xshield. For the event that matched this rule, the Webhook with the appropriate action will be invoked.
-
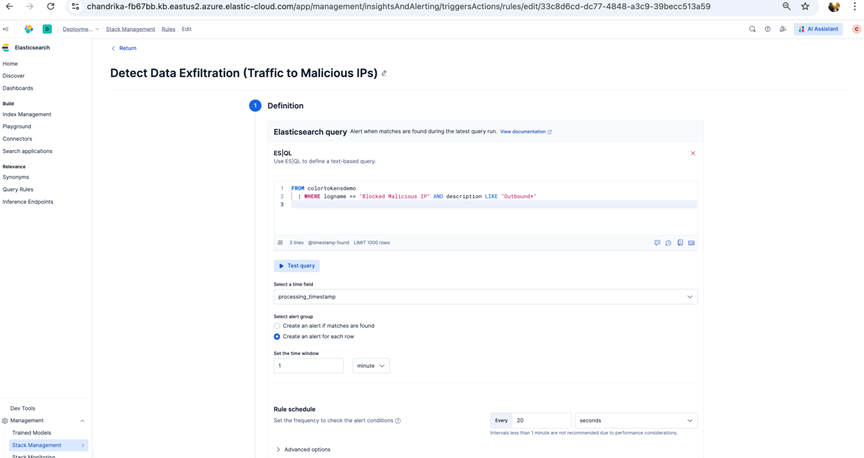
Define the ES|QL Query
Esql :
FROM colortokensdemo
| WHERE logname == "Blocked Malicious IP" AND description LIKE "outbound+"
Query Explanation:
-
Data Source: colortokensdemo index (CEF logs)
-
Filter Conditions:
- logname == "Blocked Malicious IP" - Matches security events blocking malicious IP connections
- description LIKE outbound+ - Identifies outbound traffic patterns
-
Configure Time Settings
-
Time Field Selection:
- Select processing_timestamp as the primary time field
- This ensures alerts are based on when events were processed
-
Time Window:
- Set to 1 minute
- The rule evaluates data from the last 1 minute window
-
-
Set Alert Grouping:
- Alert Creation Method:
- Create an alert for each row - Generates individual alerts for each matching event
- Alternative: Group alerts by specific fields to reduce alert volume
- Alert Creation Method:
-
Configure Rule Schedule:
- Set the Execution Frequency in terms of minutes for the better performance
-
Test the Query
- Validation Steps:
- Run the ES|QL query in Kibana Dev Tools to verify syntax
- Check if results match expected malicious IP patterns
- Validate time field mapping in the index
- Validation Steps:
-
Confirm data exists in the specified time window
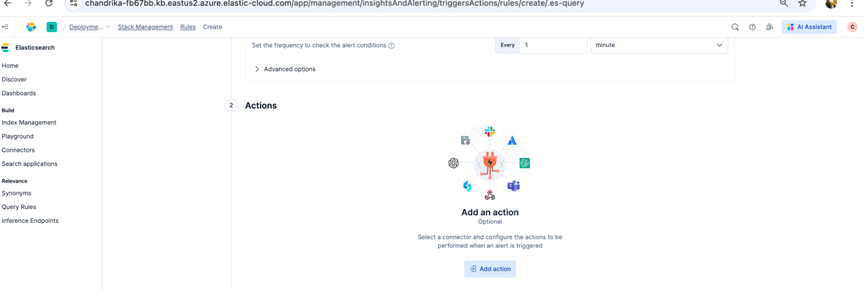
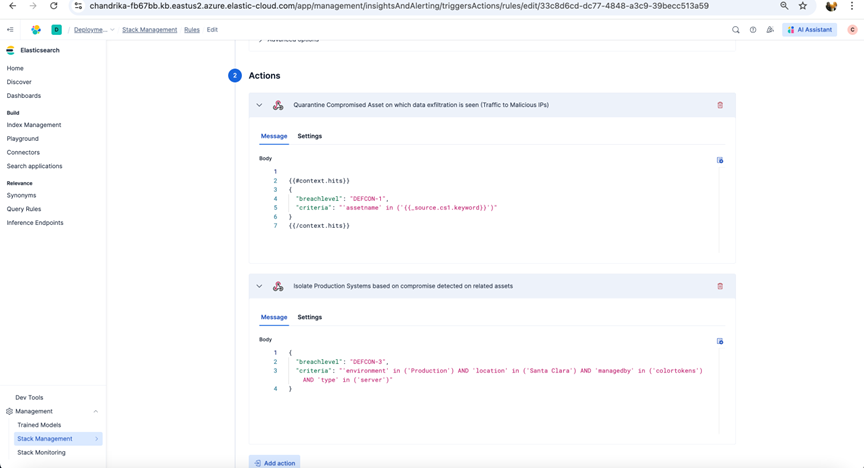
- Configure Rule Action as below:
-
Click on Add Rule Action
-
Select one or more webhook connector to be linked to Rule action
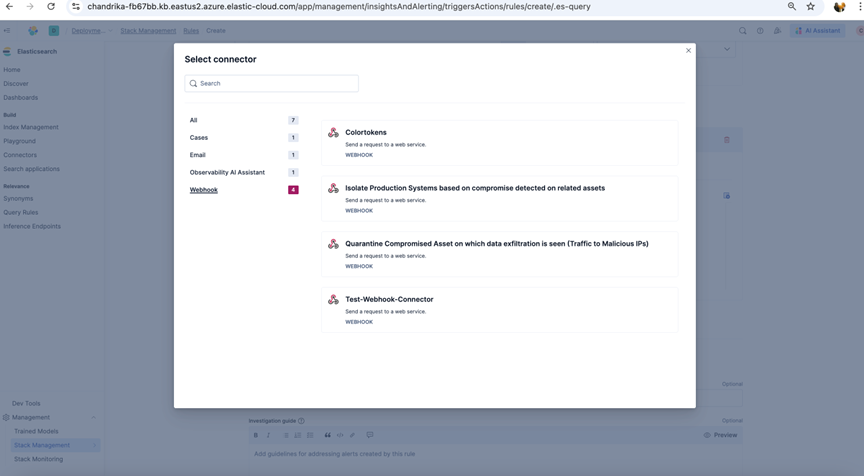
-
Update the action body as per the requirement of API called in the webhook connector
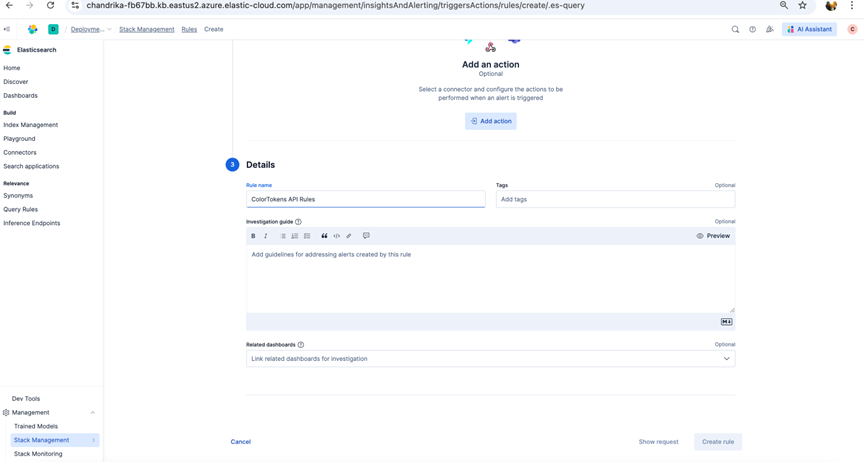
- Configure Rule Details such as Rule name, Tags as below and click on Create rule.
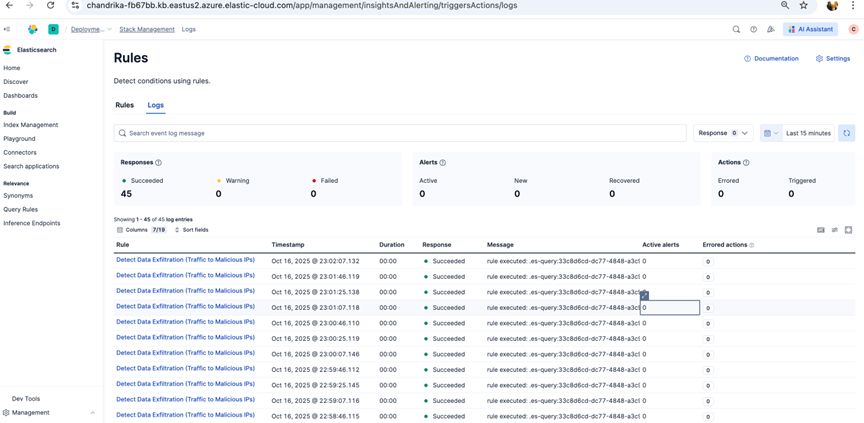
7. Verify Rules Logs for the successful rules execution
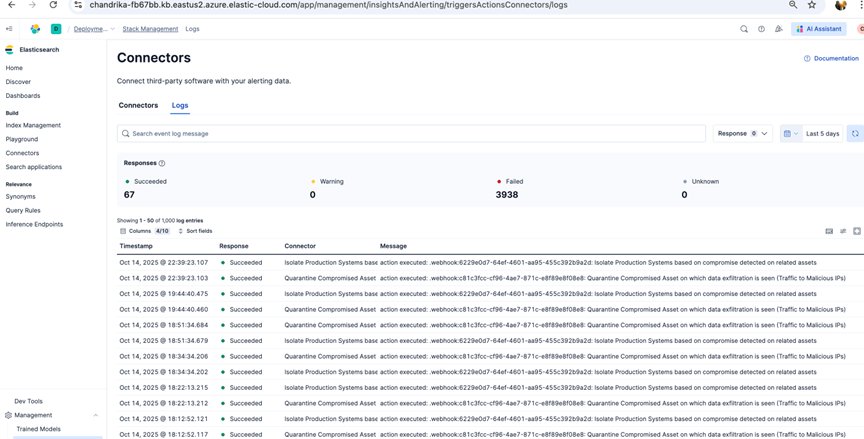
8. Verify webhook connector Logs for the successful Trigger
9. View Triggered Breach Response in Xshield
You may review the triggered breach response in Xshield by logging into the Xshield Platform, Navigate to the specific asset and check the Breach Response tab.
Summary
This guide detailed how to configure Elasticsearch Cloud to ingest event data from the Xshield Security Platform and connect it with Xshield’s Breach Response through a webhook. The setup enables automated detection and response by triggering breach actions in real time when specific events or alerts are identified.
Please note that the correlation event could be triggered from other sources and they can be configured accordingly in the same webhook definition.