Observability
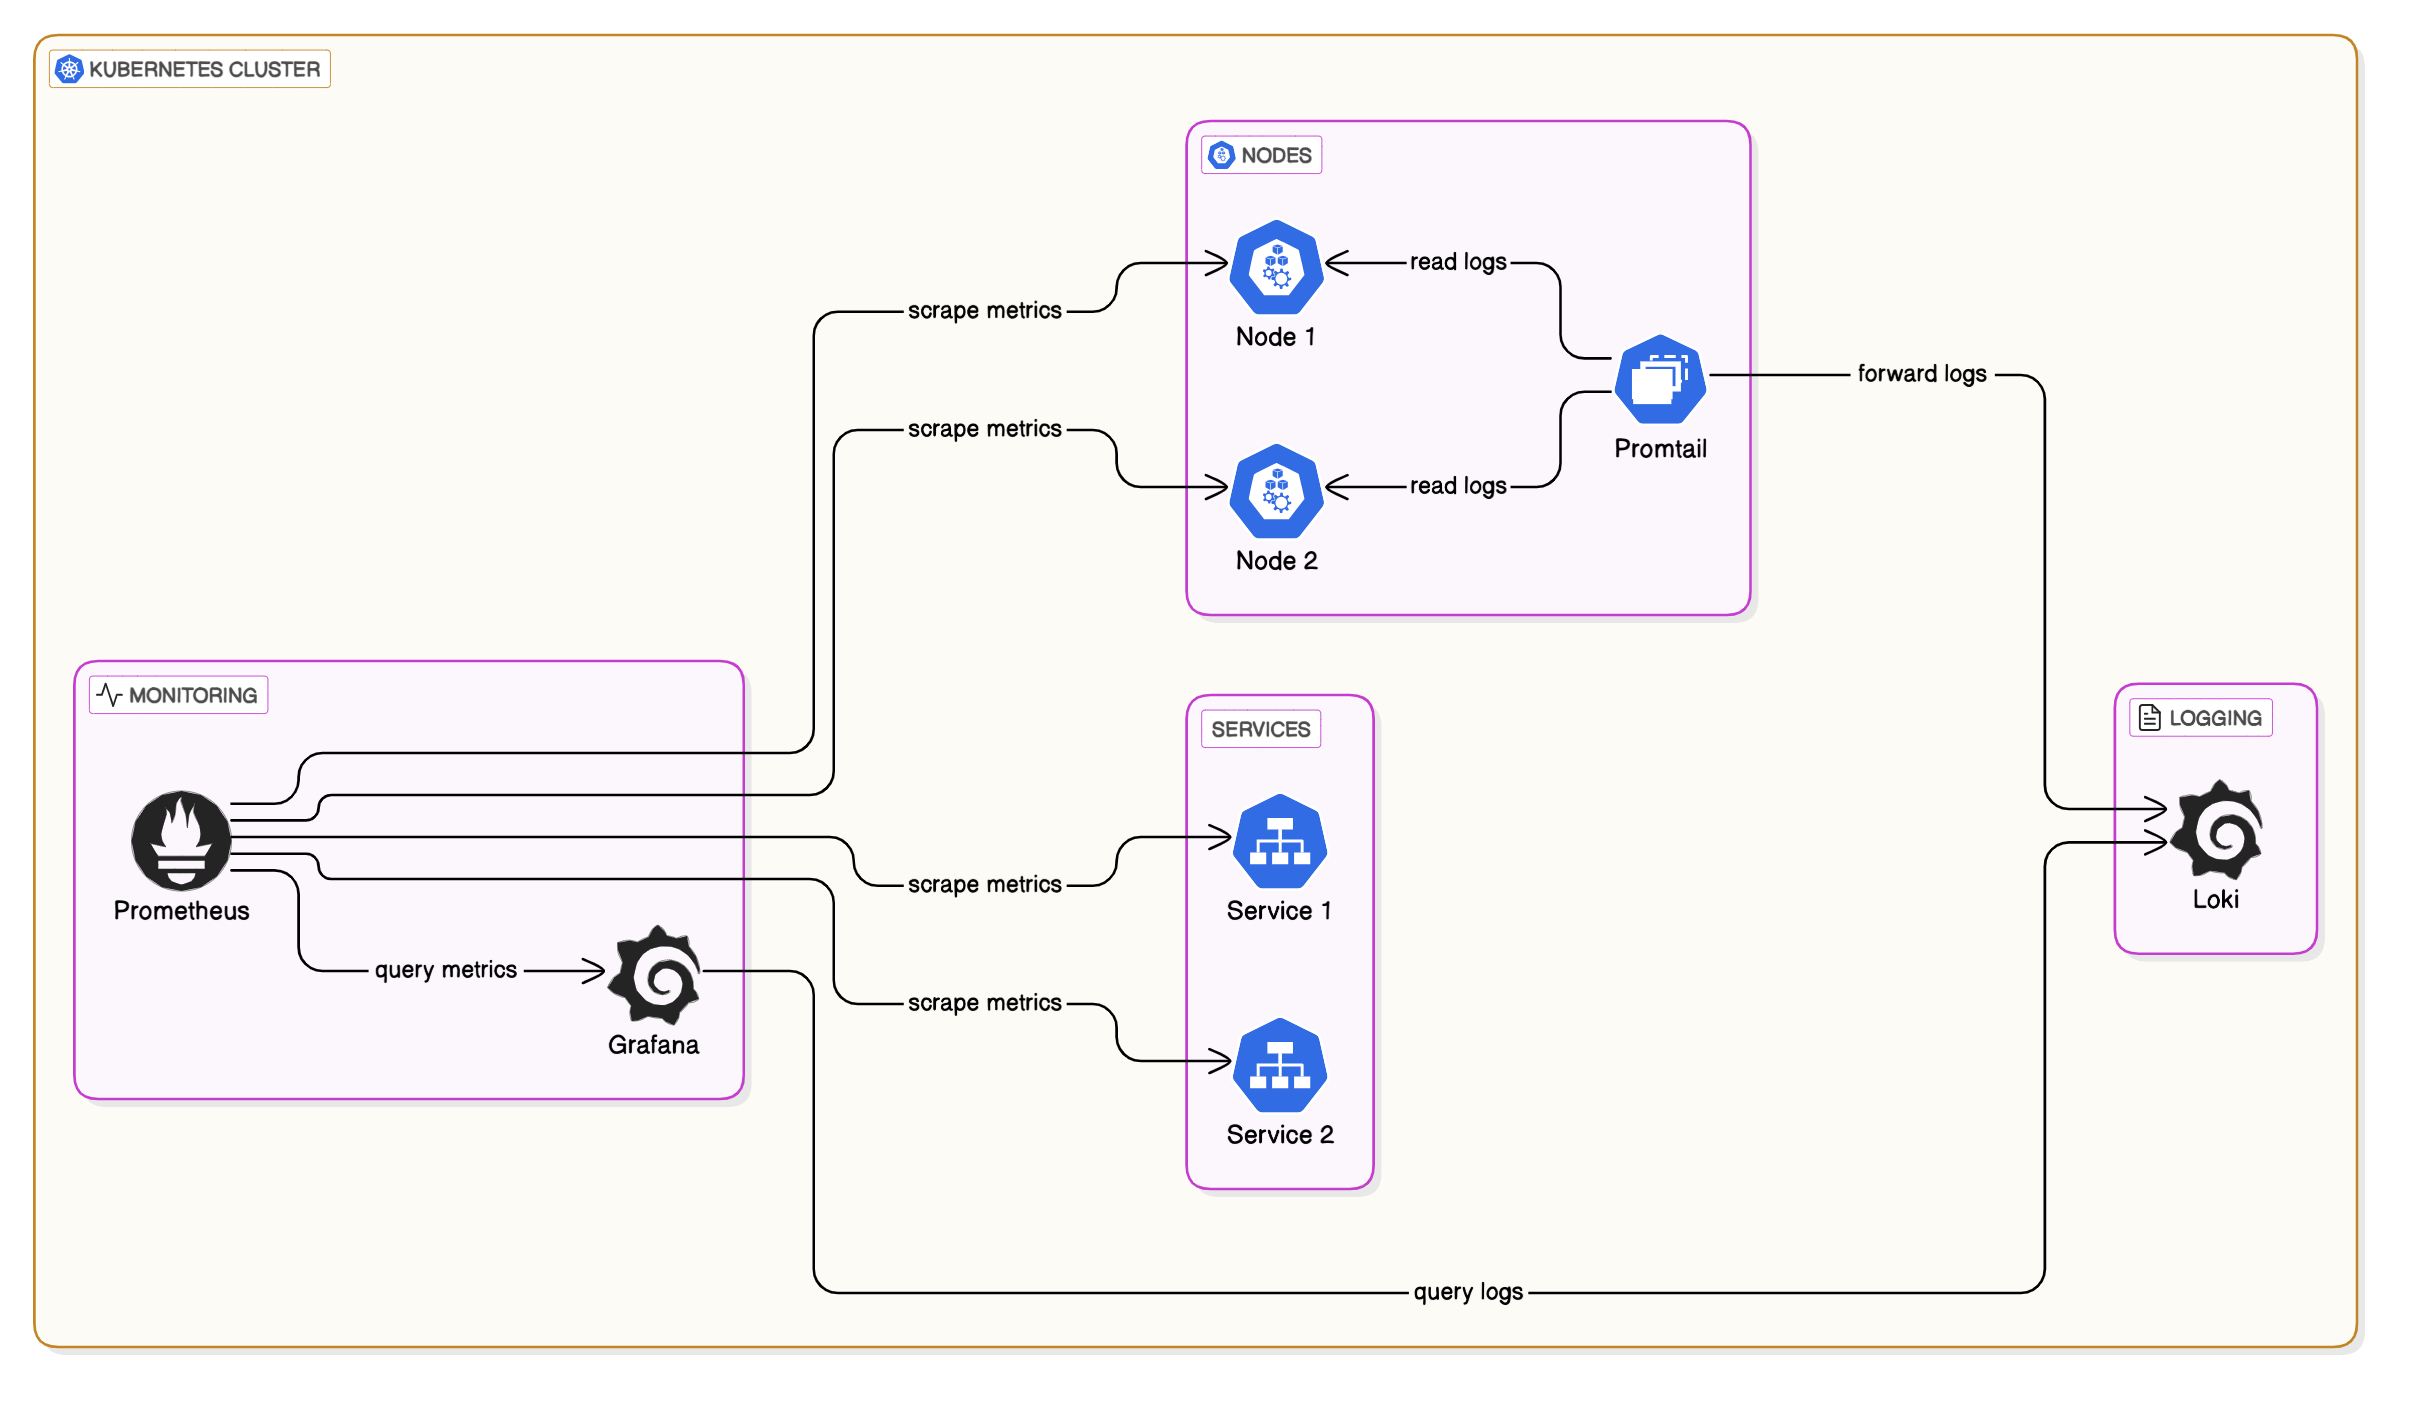
The observability stack is pre-installed and deployed alongside the Xshield platform, enabling comprehensive monitoring of key components and providing configurable alert notifications to destinations such as email. This observability is essential for maintaining the health and performance of the Xshield platform.
The stack primarily consists of the below components
- Grafana
- Prometheus
- Prometheus Node Exporter
- Prometheus Kube State Metrics
- Loki
- PMM - Percona Monitoring and Management
- Istiod
- Loki Promtail
High-Level Overview
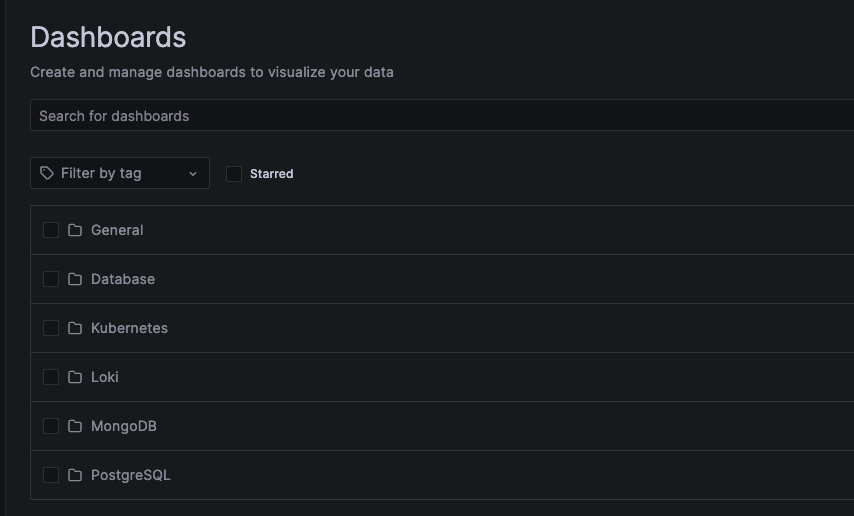
Grafana Dashboards
Dashboards in Grafana provide insights into past and current usage/health/utilisation of the cluster and associated resources.